Scope

by Augmentl Studio

One operational surface for electronic artworks deployed globally, including the portal network. Built by the person already helping keep them running.

scroll
The problem

The portal network operates almost completely in the dark. Problems surface through visitors, or not at all.

When a portal goes dark

  • We find out from a visitor, a local operator, or a guess.
  • Diagnosing what actually happened can take hours, working blind across the full installation stack
  • Recovery means logging into Splashtop and attempting a restart through a buggy app. No real diagnostic capability, no root cause.
  • Reports from the audience or client are a last resort and should not be necessary at all. If anything, the client should be informed proactively by us.

The deeper problem

  • Operational knowledge lives in one person's head: a single point of failure for a global network
  • No tool encodes what a healthy portal looks like, so nothing can detect when one isn't
  • The only remote-management layer we had was Konstruktiv, which covered a narrow control layer and is being retired as we transition to the new system
  • Splashtop is a remote desktop, not a monitoring solution, and should be a last resort rather than the normal way to understand portal health.
Konstruktiv Portal Remote Control
Konstruktiv Controller
Context

We did have a remote-management app, but it only touched the control hardware layer.

  • Mostly a Controllino view
    It was mainly a window into the control hardware layer: heartbeat, two temperature probes, and a narrow firmware/control picture.
  • Nuclear recovery path
    In practice it was mostly used to check whether the portal was alive and try to bring it back with boot, shutdown, or reboot controls.
  • No display stack access
    It could trigger a blank state, but not the actual LED stack: no NovaStar brightness control, no panel telemetry, no display health reasoning.
  • Some AC controls, but weak in practice
    It also exposed AC controls, but these were limited and not reliable enough to count as a real operating layer.
  • Being retired during the transition
    It remains available only as a stopgap while Scope takes over, because it never expanded beyond the narrow control layer the network actually needs.
Transition

The shift is from controlling a cabinet to operating the whole installation.

The Konstruktiv app proved the value of having a mobile control surface. Scope keeps that convenience, then extends it across the full installation: PC, stream, display, controller, power, environment, and network.

What the old controller mostly was

  • A narrow Controllino and reboot surface
  • Useful when something already looked broken
  • Little visibility into VW, NovaStar, WAN, UPS, AC, or screenshots
  • Operational knowledge still lived outside the tool

What Scope becomes instead

  • One operating surface across PC, display, stream, power, environment, and network
  • Monitoring, diagnostics, and controls in the same product
  • Alerts, logs, screenshots, and history that explain what failed
  • A system a team can operate, not just the person who built it
This slide is about the product surface expanding. The operating loop comes next.
What Scope is

An operational system for electronic art installations. Not just another dashboard.

Scope understands a physical installation the way it actually works: compute, display, environmental controls, cameras, power, network. One operational model across the installation, rather than fragmented tools and handoffs. The portal network is where it is most developed today, but the core product and IP can support future Portals, Augmentl, and other installation deployments too.
PC
OS · services · logs
LED
NovaStar brightness · panels
Env.
Controllino · AC · UPS · WAN
A/V
Cameras · VW · streams
Coverage

Scope sees what an installation actually is.

Visual state

Live kiosk screenshot + operator display capture · LED brightness and panel temperature grid · VW call state and stream health · freeze detection · 30-day rolling uptime.

Display control

NovaStar brightness, blanking · weather/solar auto-brightness with thermal override · per-panel temperature mapping.

Hardware layer

Controllino system state · AC alarms and probe temps · UPS supercap state · energy draw · WAN 1/2 with failover history · PC health and uptime.

On-site commissioning

Camera exposure, white balance, virtual tilt, lens correction · presence detection · per-installation configuration profiles.

How it fits together

Scope architecture.

Cortex · Augmentl Studio Server
📱 Scope Controller
Mobile-first PWA · on-site and remote · per-portal deep control
💻 Augmentl Dashboard
Fleet overview · telemetry history · incident feed
🔔 Alerts
Telegram · Discord · escalation schedule
☁ Cloud Server
Scope Hub
MQTT command bus & telemetry stream · retained state · WSS
📍 Portal Site
🖥 Scope Bridge on Portal PC
Portal-side runtime on the PC · owns streams, screenshots, service watchdogs, and device integrations exposed through the controller
🟧 Controllino
Separate control-hardware path · heartbeat, relays, thermal, boot/reset telemetry direct to Scope Hub
▶ Video Window
Portal AV app (3rd party) · monitored & kept alive by Scope Bridge · future: native replacement
🟪 NovaStar VX
LED brightness · blanking · panel temps via Scope Bridge
🎥 Camera
Exposure · VISCA · virtual tilt · lens via Scope Bridge
🔋 UPS + AC
Bicker supercap · AC alarms · Modbus via Scope Bridge
📡 WAN
Peplink dual-WAN · 5G failover via Scope Bridge
Operating loop

Observe. Diagnose. Act. Learn.

Phase 01 · observe

Observe the real installation

Scope Bridge, Controllino, NovaStar, UPS, WAN, camera, screenshots, and stream checks publish live state into one retained operational picture. The portal initiates every connection outward; no inbound site exposure is required.

Phase 02 · diagnose

Diagnose across layers

Events, telemetry, screenshots, and health rules are correlated so operators can see whether the issue is in the PC, stream, display, environment, or network before guessing at a fix.

Phase 03 · act

Act with scoped controls

Auto-blank, auto-restart, relay reboots, screenshot refreshes, and operator interventions can happen immediately when the blast radius is understood. Human-triggered controls stay scoped and confirmation-gated.

Phase 04 · learn

Learn at network scale

Every incident leaves behind event history, uptime semantics, and cross-portal patterns that make the next diagnosis faster and less dependent on one person remembering what happened last time.

Scope is not just a UI. It is the loop that turns installation data into operational memory and safer action. Move operational knowledge out of one person's head and into the platform itself.
Already in use

This is already useful in real operations. The question is whether to formalise and extend it.

Portal 5 is the live proving ground. The system is already being used to see the installation, diagnose faults, and act faster than a manual Splashtop check ever could.

Live on a real portal

Not a mockup. Not a concept video. The controller, dashboard, alerts, and operating logic are already being exercised against a live installation.

Already solving real operator problems

It makes screen state, stream health, power, thermal conditions, and intervention paths visible without depending on someone noticing a problem first.

Past the invention stage

The remaining work is productising, broadening access, and hardening rollout. This pitch is about adopting and extending the system, not imagining whether it should exist.

Built from inside the operating work

Scope comes from the same day-to-day operational reality already supporting these installations, which is why it fits the actual problem surface while still remaining reusable beyond Portals.

Dashboard layer

The controller is not the whole operating surface. The dashboard is the layer around the portals.

The controller is where you act deeply on one installation. The dashboard is where you understand the fleet, manage project and install context, coordinate work, and expose narrower views for portal teams when needed.

Layer 01 · fleet

See the network at once

Compare sites, spot weak portals, watch pairings, and understand where attention is needed across the network, not just inside one portal page.

Layer 02 · project

Carry install context

Tasks, notes, deploy timing, documents, client context, and rollout state belong in the dashboard layer, not crammed into the runtime controller.

Layer 03 · team

Different views for different operators

Augmentl can use the full workspace, while Portals can have a portals-only variant that shows just the network-relevant operational surface.

Layer 04 · product

One system, multiple surfaces

The value is one shared system that can expose a deep controller, a fleet dashboard, a portal-team view, and later client-facing slices of the same model.

Augmentl Dashboard operations view
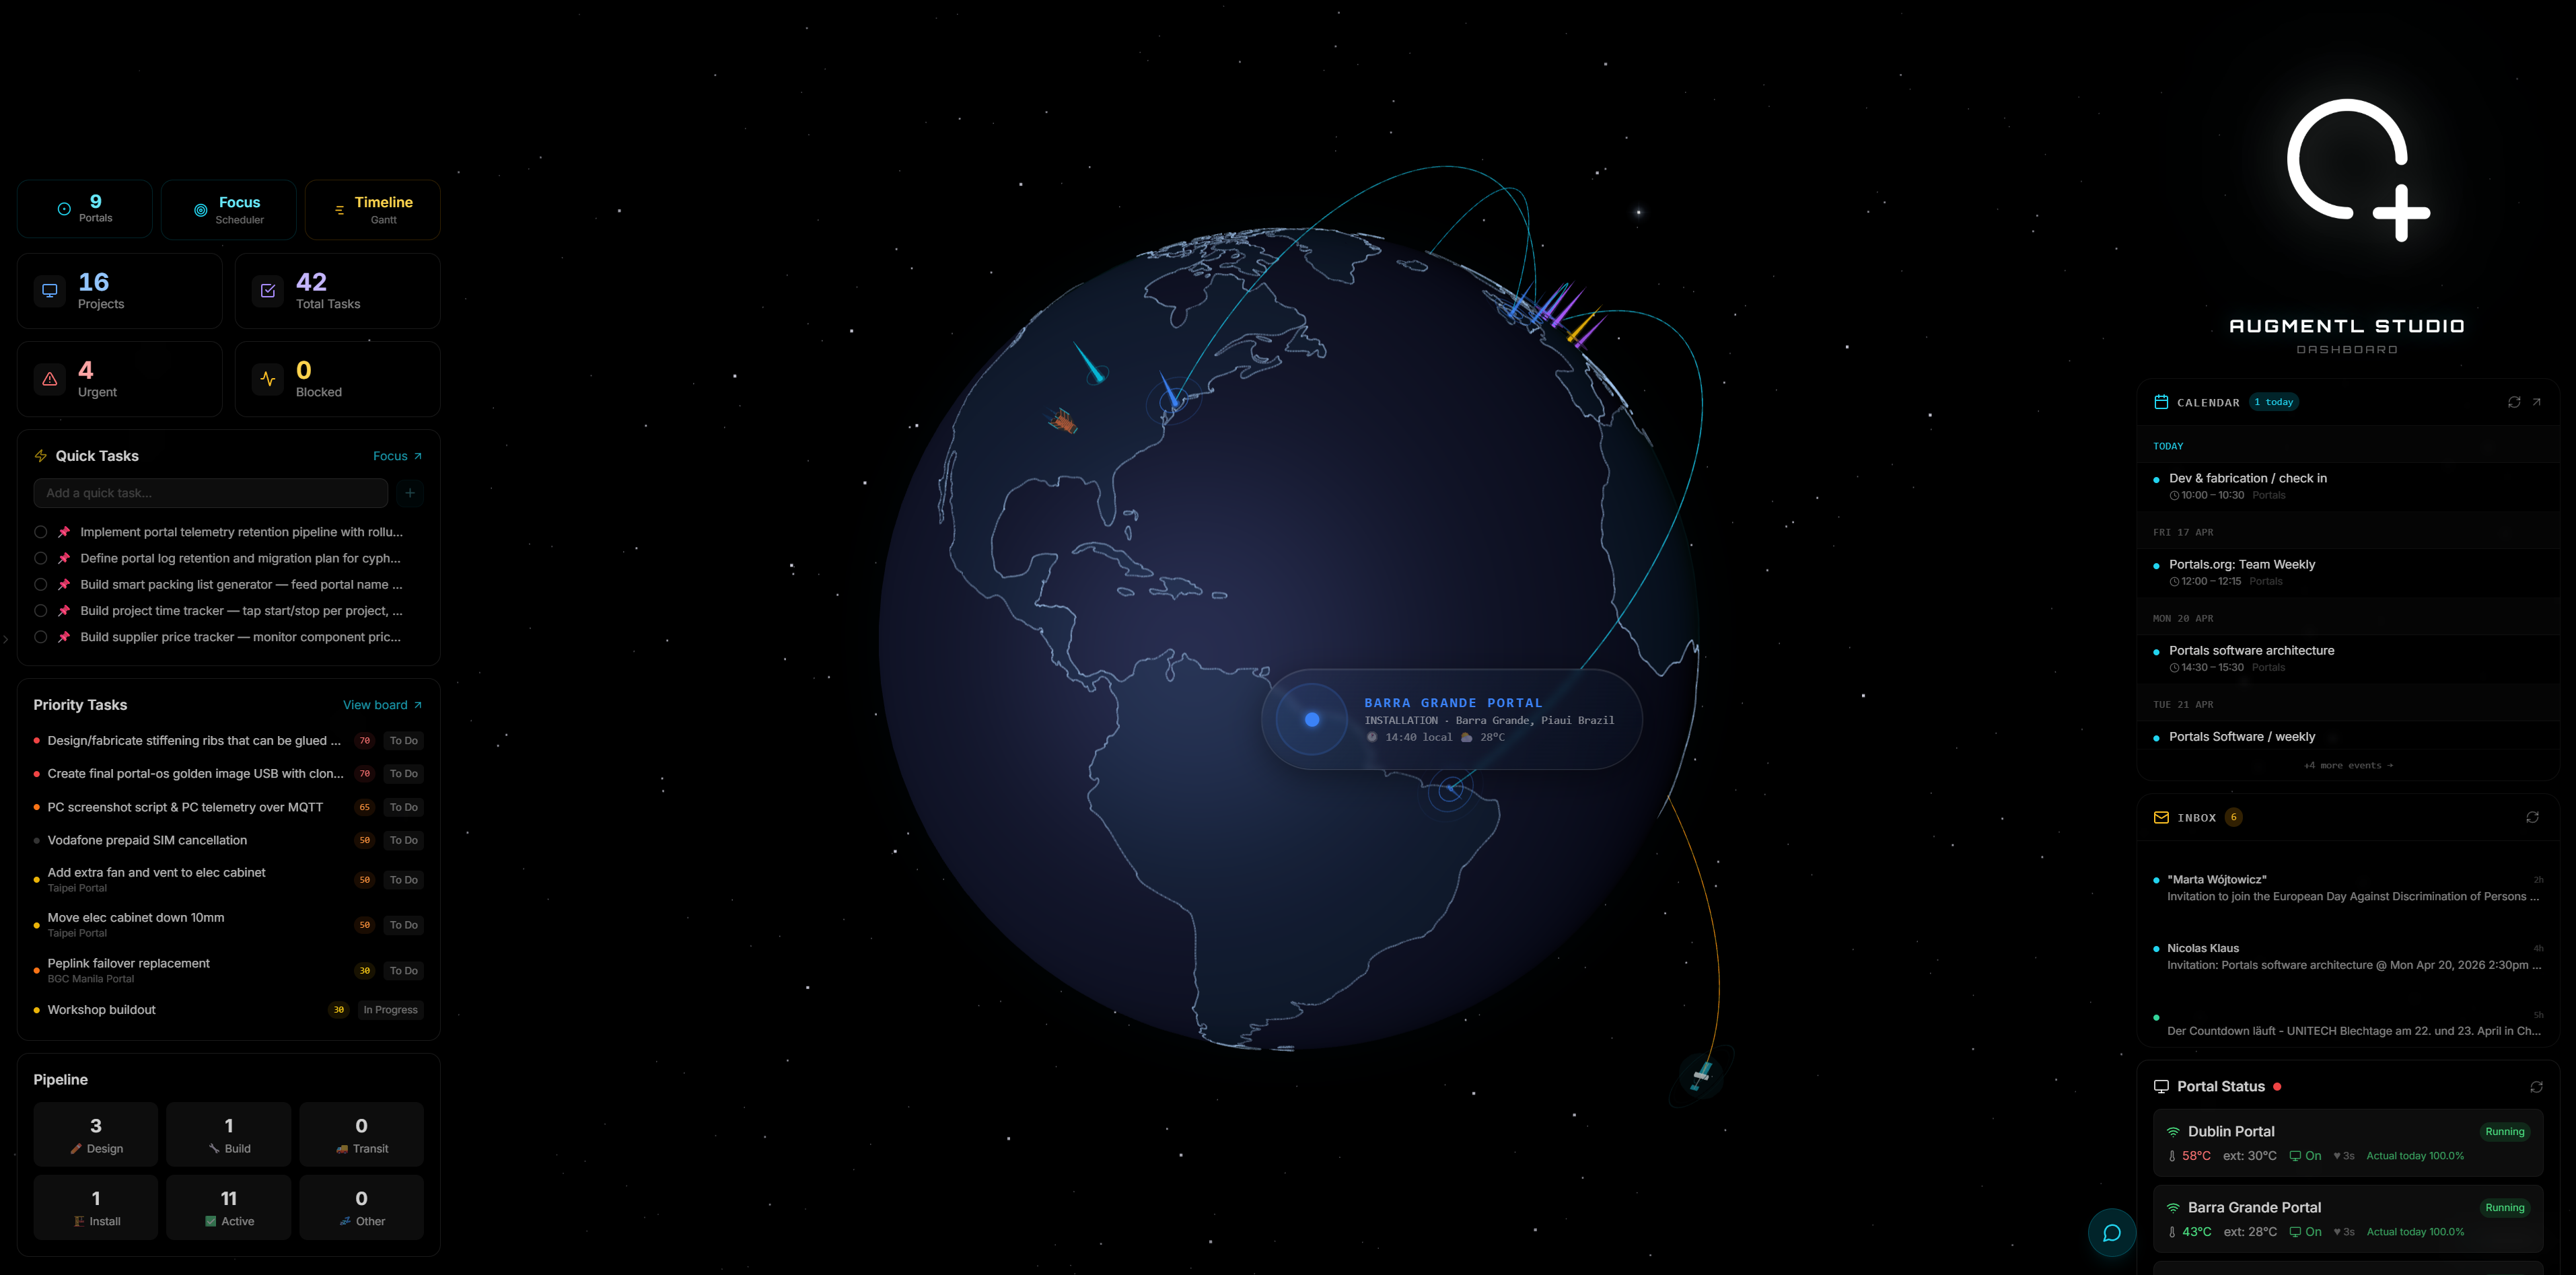
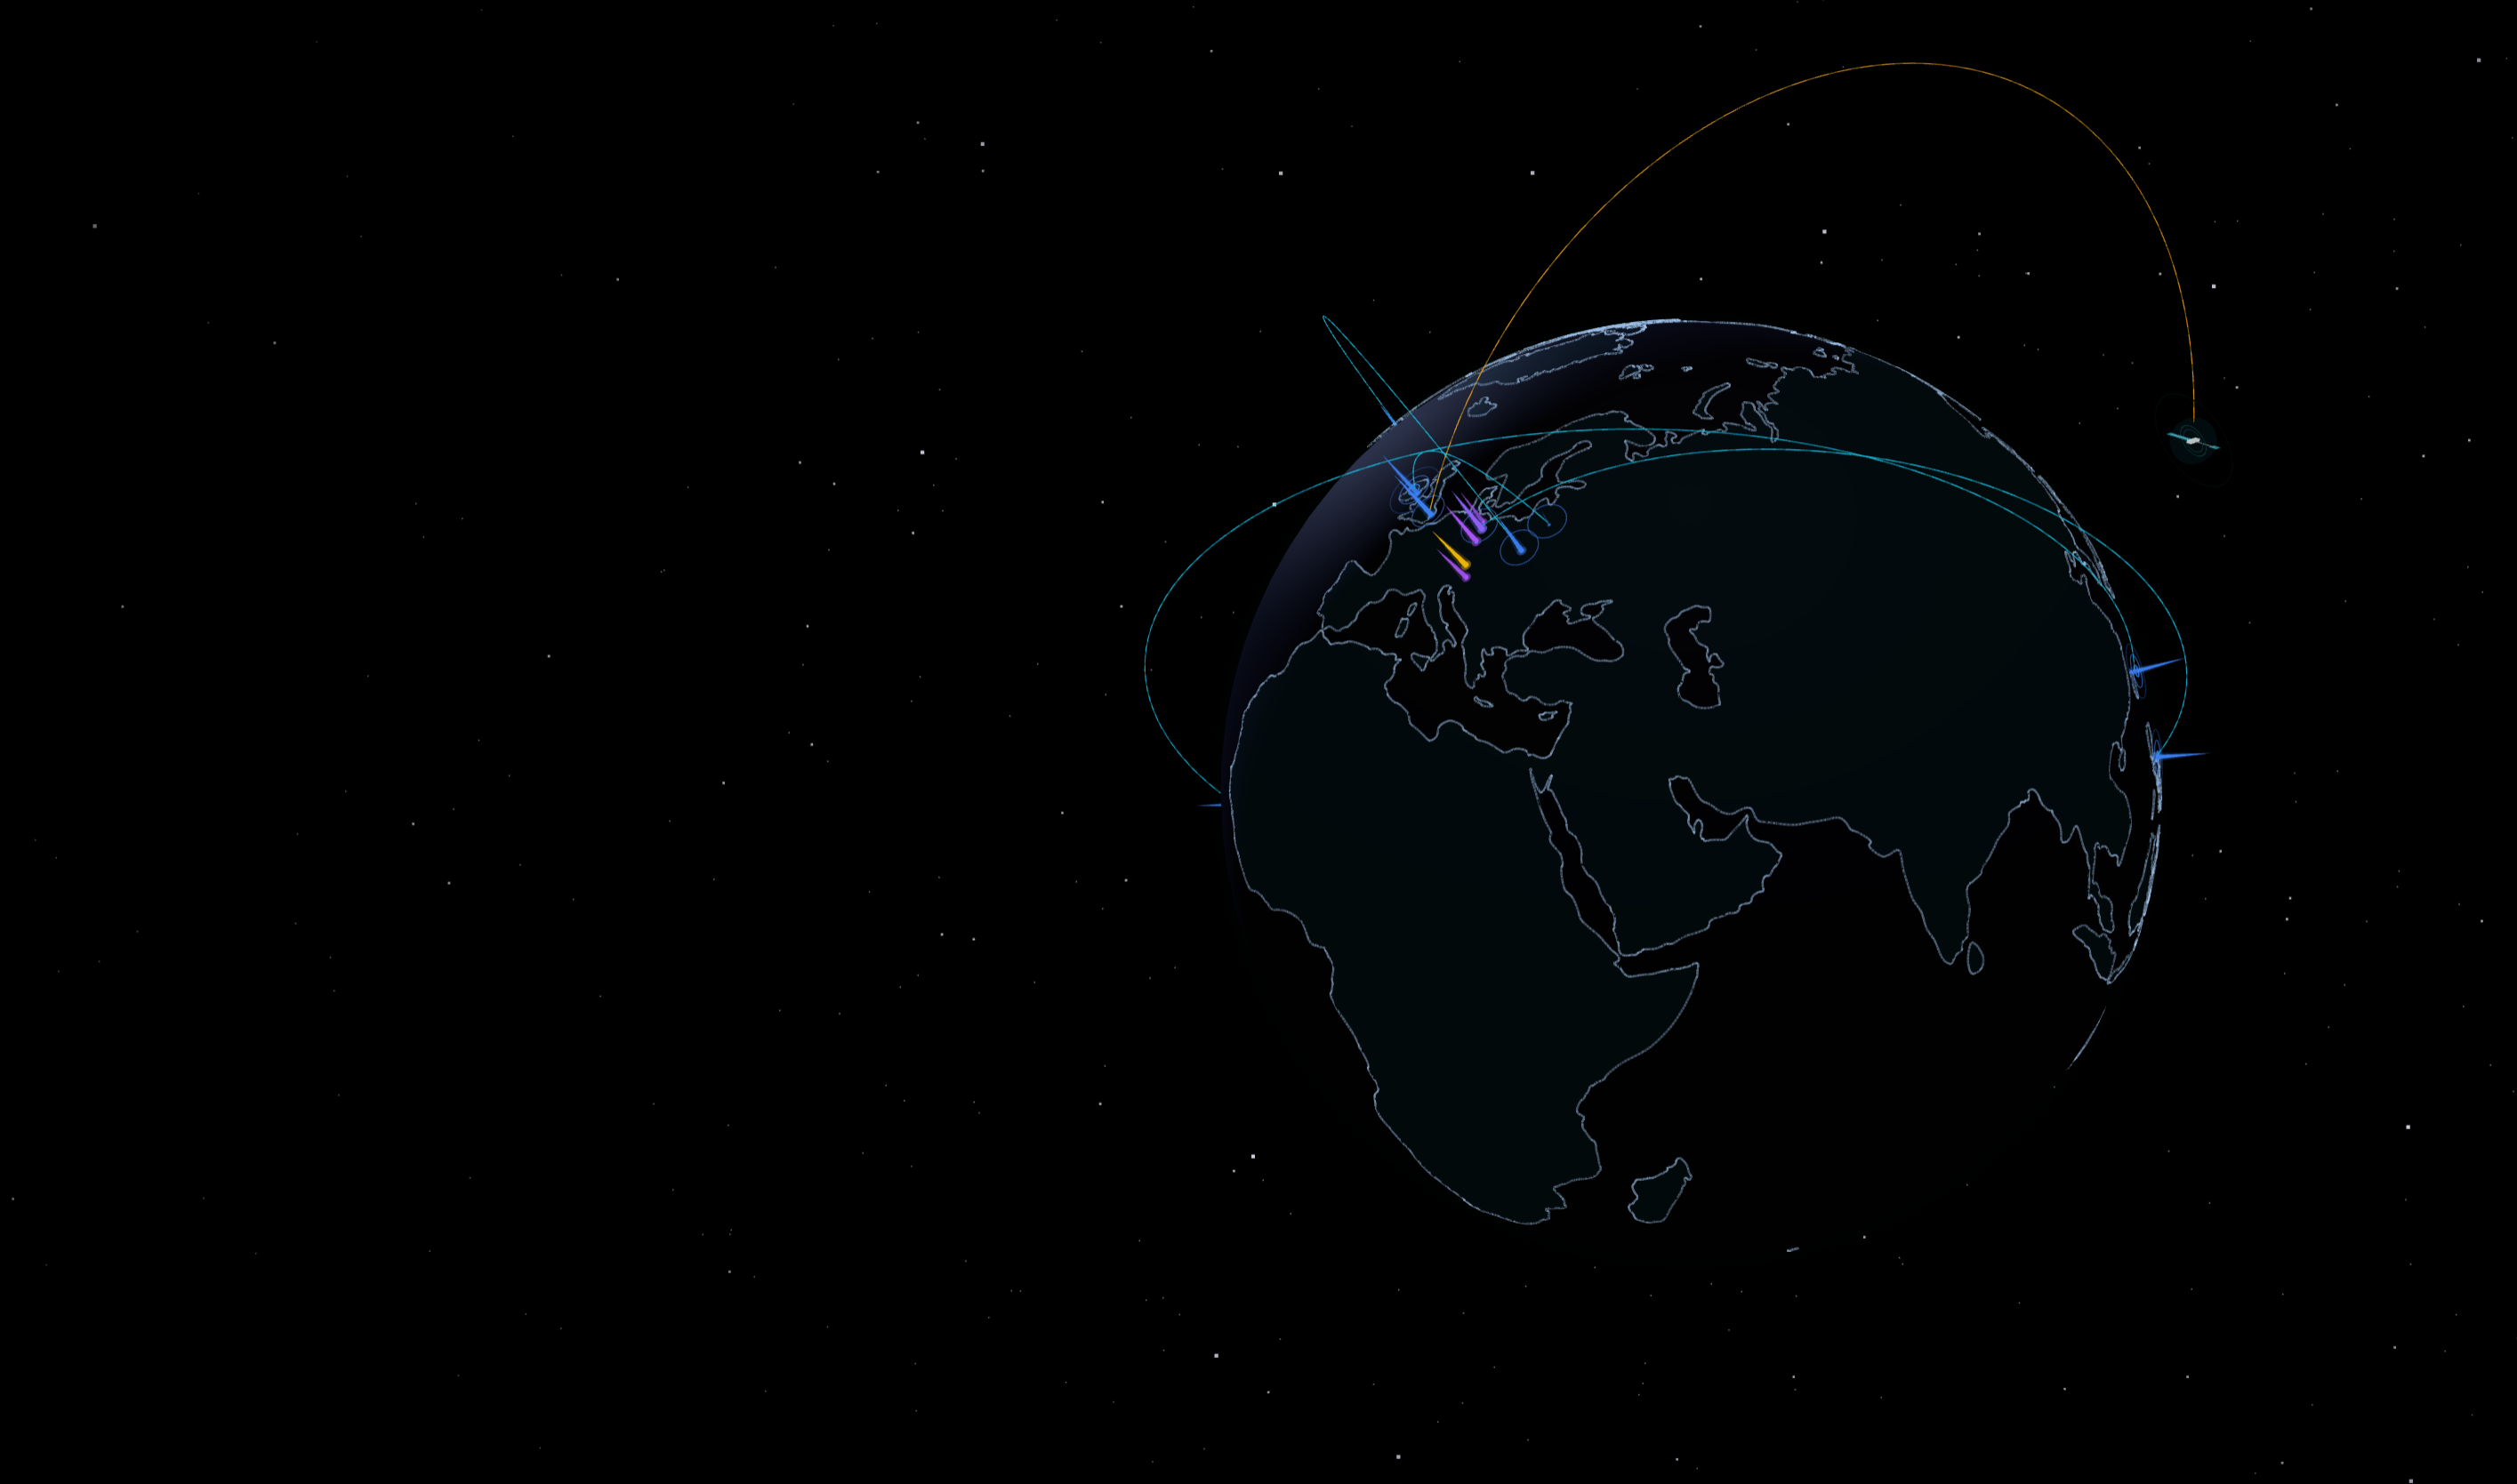
Augmentl Dashboard · operations view across portals, projects, tasks, calendar, and inbox
Dashboard layer

Augmentl Dashboard matters because the app is not the whole operating surface.

  • Fleet view, not single-portal view
    The controller tells you what is happening at one installation. The dashboard tells you what is happening across the fleet, where attention is needed, and how sites compare.
  • Operations layer around the portals
    Projects, tasks, priorities, calendar, inbox, and portal status all sit around the runtime layer. That is essential for actually operating a network, not just observing one site.
  • Useful to Augmentl and to Portals
    Augmentl needs the broader operating surface. Portals could also have a portal-team-specific dashboard variant that only shows the portals layer, without the rest of the internal workspace.
  • Complements the app instead of duplicating it
    The controller is the deep per-portal action surface. The dashboard is the portfolio, planning, and operations surface around it.
Portals-only dashboard view
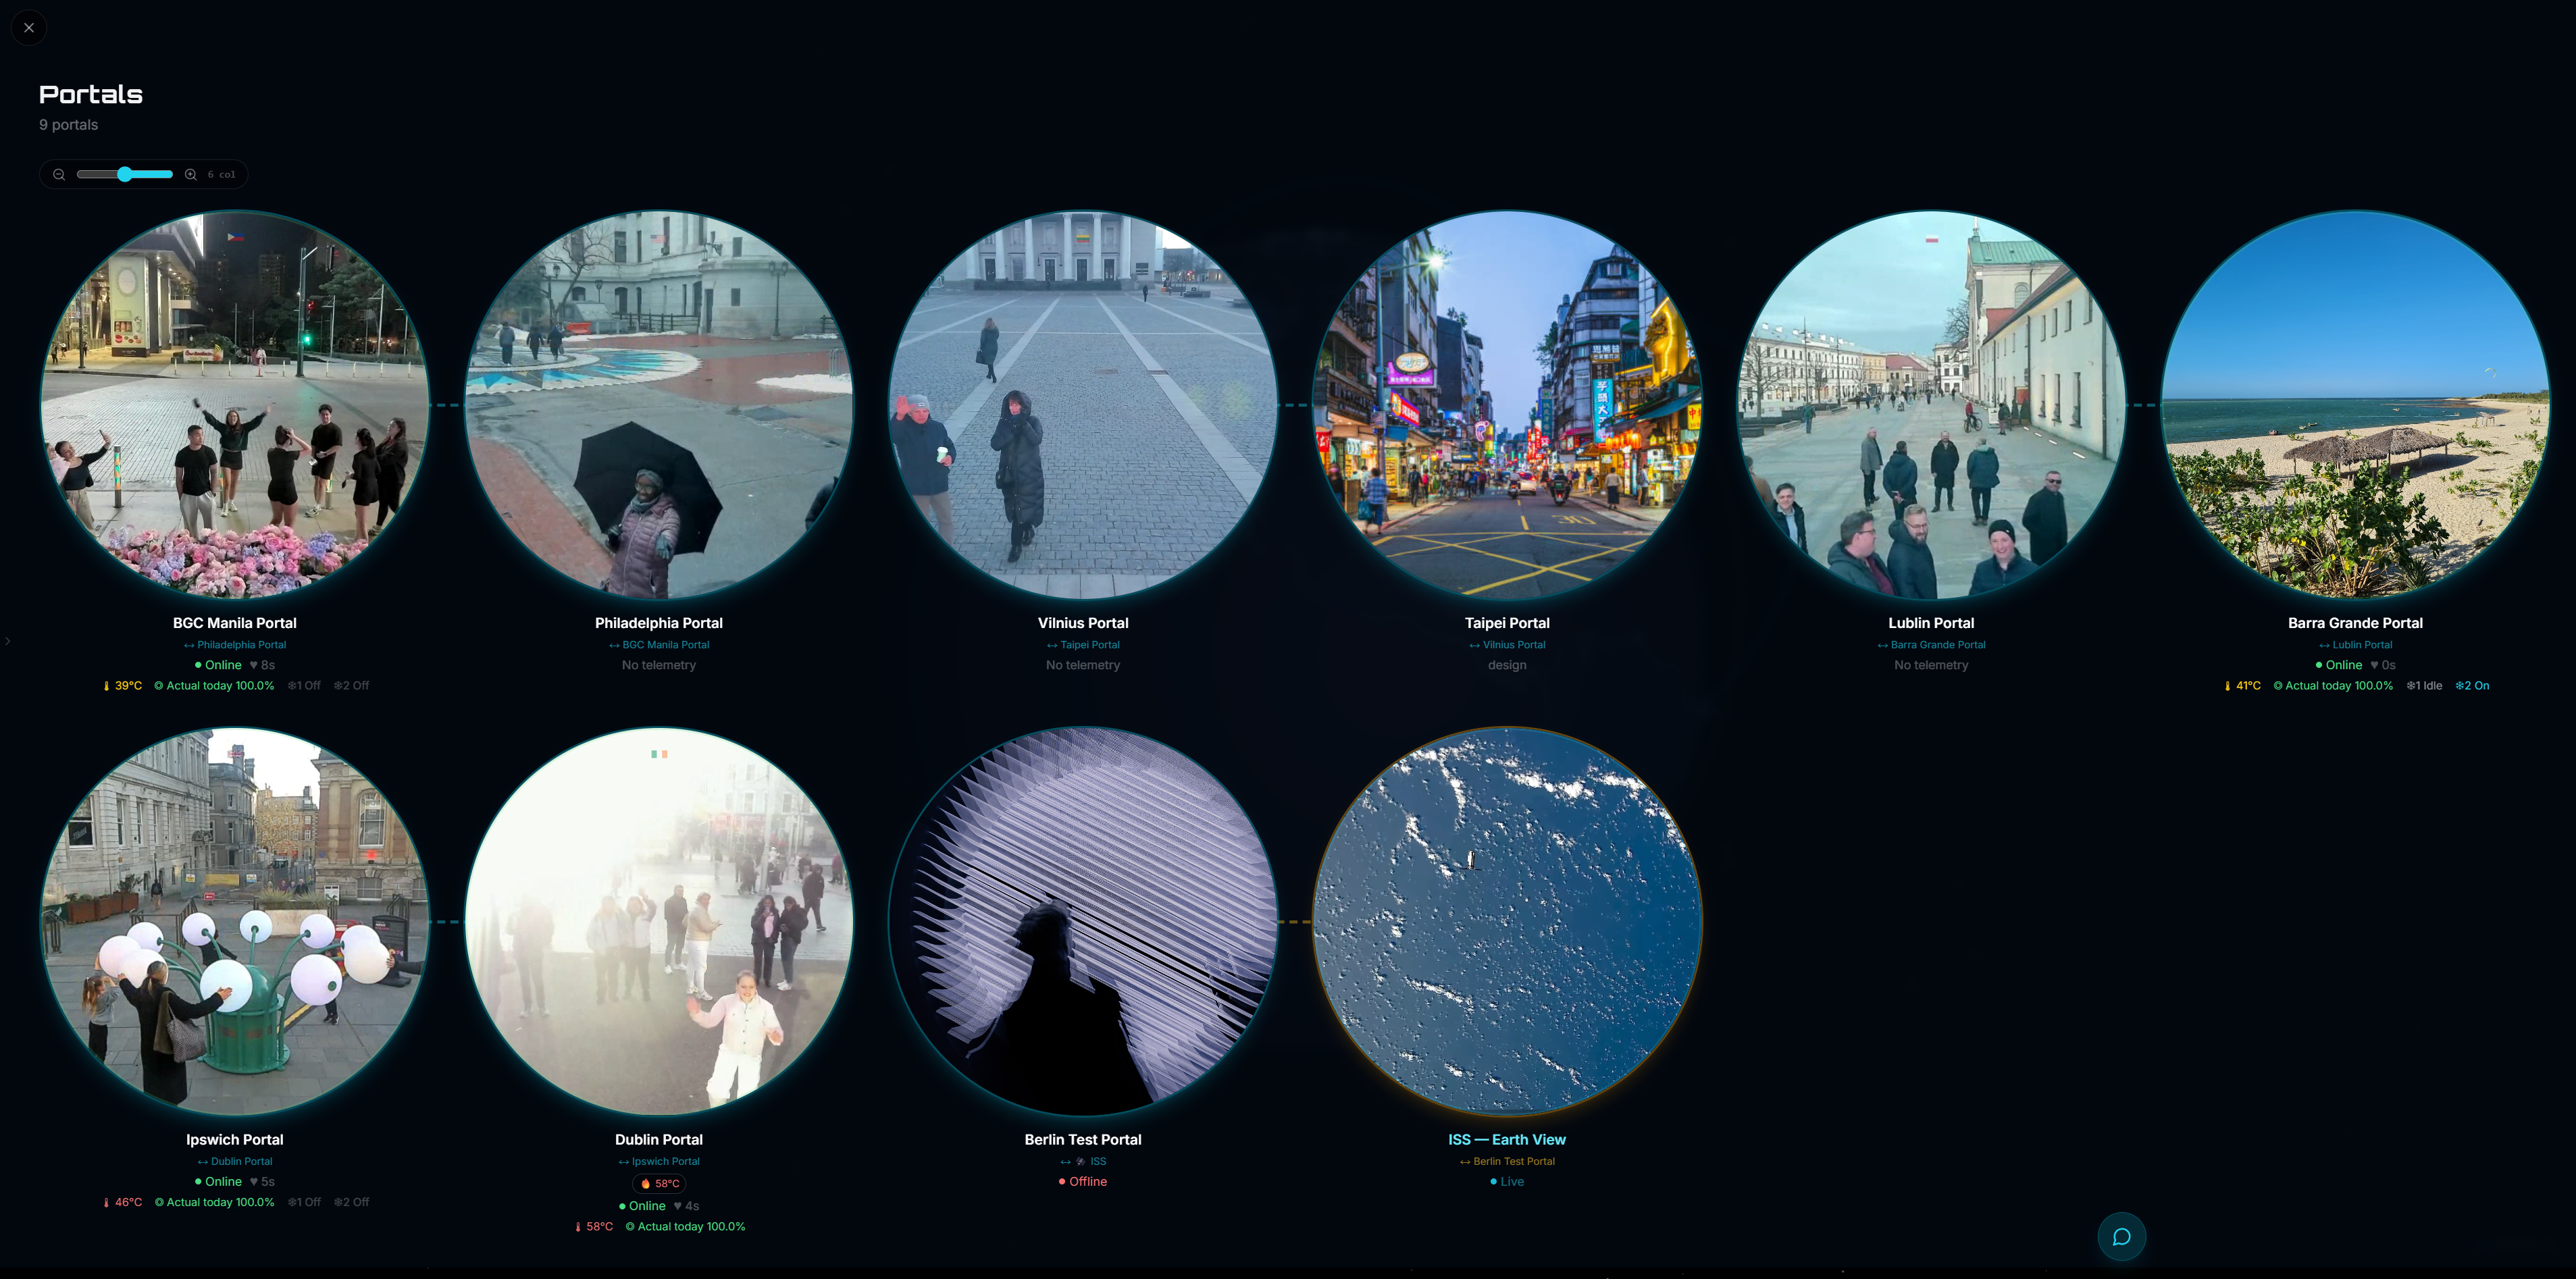
Portal-team-specific dashboard variant · portals-only network view
Portals-only variant

The same system can expose a dedicated portals dashboard without the rest of the Augmentl workspace.

  • Only the portal network surface
    Status, pairings, uptime, telemetry presence, offline nodes, and live visual state can all be shown in one clear portal-team view.
  • Useful for shared operations
    It gives Portals a clean operational surface for the network without requiring access to broader project, inbox, or internal coordination layers.
  • Good basis for scoped access
    This same partitioning is what later makes client-facing or portal-team-specific access realistic, because the data is already separated into appropriate surfaces.
  • Same backend, narrower front-end
    The point is not another product. It is a narrower view of the same product, tuned for the portal team’s actual day-to-day needs.
Portal project page inside the dashboard
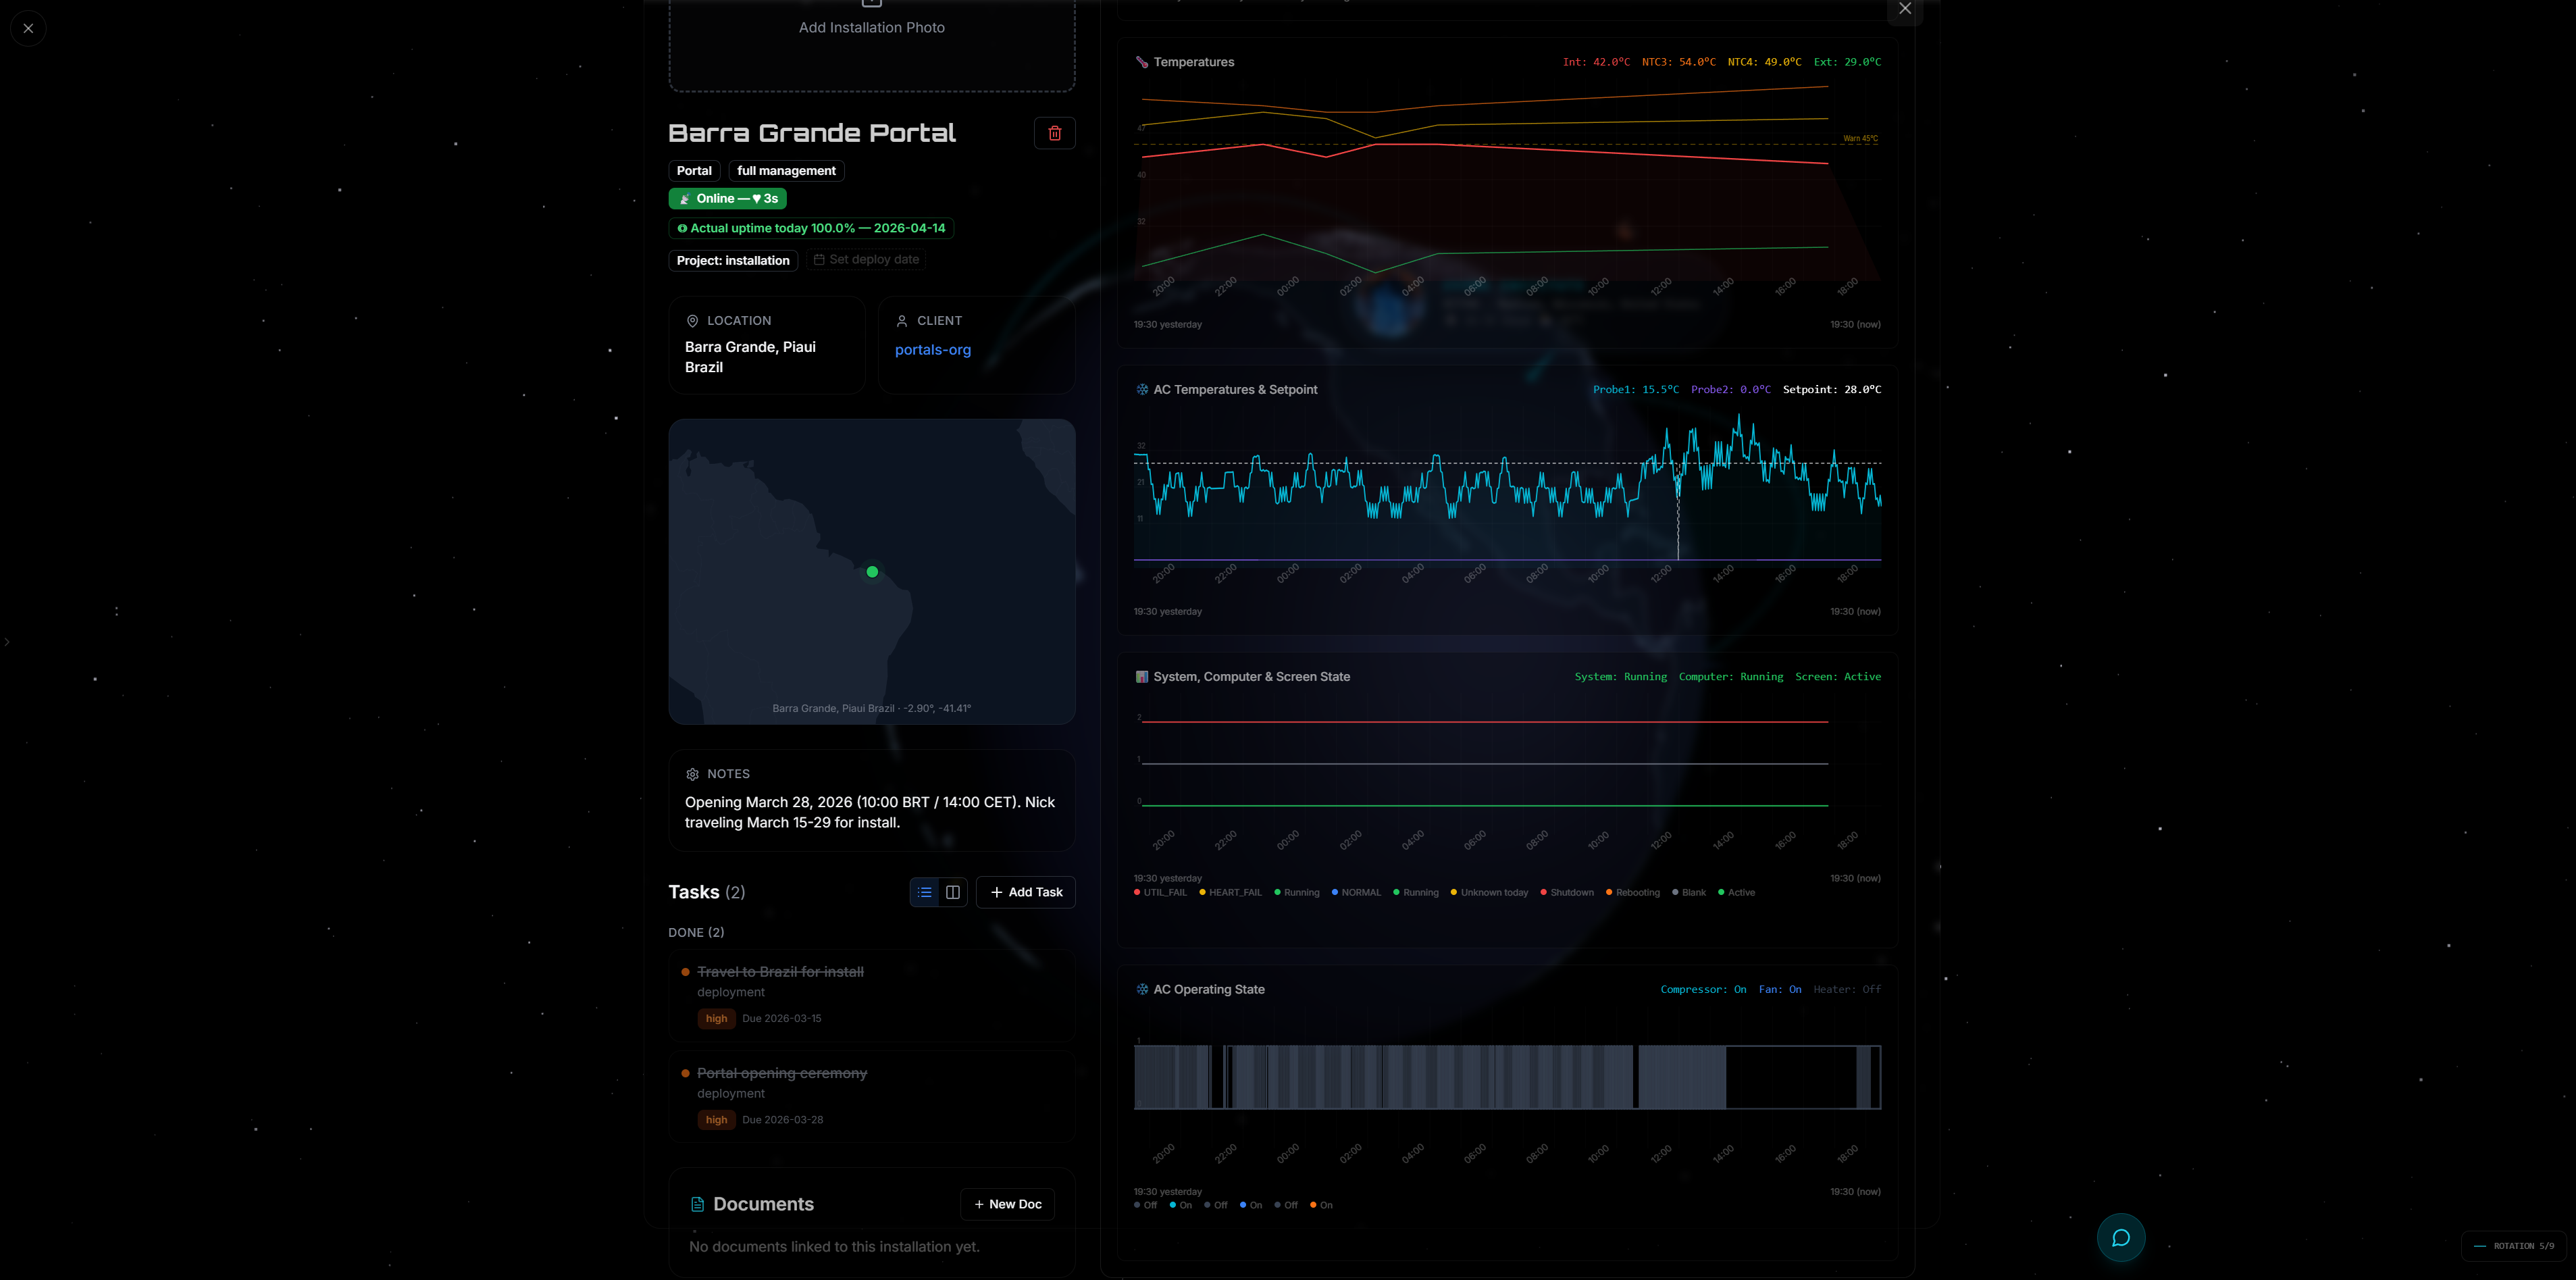
Portal project page · install context, notes, tasks, docs, and monitoring in one place
Project-specific dashboard view

The dashboard adds project and install context that the controller app should not have to carry.

  • Project and install context
    Location, client, notes, deploy timing, tasks, documents, and site status all belong here. That is important operational context, but it would clutter the controller app.
  • Useful beyond runtime telemetry
    The dashboard is where you manage installation work, deployment readiness, and project history around a portal, not just the live controls for the hardware itself.
  • Portal-team-specific variant is still possible
    The same system can also expose a portals-only dashboard for the portal team: status, pairings, uptime, telemetry presence, and live visual state, without the broader Augmentl workspace.
  • Same data model, different surfaces
    The key point is one shared system exposing different views for operators, portal teams, and eventually clients.
Telegram alerts from Portal 5
Telegram alerts
Monitoring

The monitoring loop closes before a human opens Splashtop.

  • Actionable alerts, not generic pings
    Blank/unblank transitions, watchdog reboots, thermal transitions, and NovaStar state changes arrive with probable causes and uptime context already attached.
  • Operator workflow lives in chat
    The person on duty sees the incident where they are already working, can jump straight into Scope, and can coordinate without translating raw logs for everyone else.
  • Recovery updates land in the same thread
    When the screen unblanks, thermals recover, or automation restarts Video Window, the alert stream shows that too. It becomes a narrative, not a mystery.
  • Escalation stays lightweight
    For routine faults, the next step is obvious. For novel ones, the same alert thread becomes the handoff into deeper diagnosis and remote intervention.
Side by side

Scope vs the Video Window proposal.

Video Window: €500/portal/month

  • PC setup = install VW, set correct display output
  • Monitoring = someone logs into Splashtop and looks
  • Problems detected when the daily check happens, or when a visitor reports it
  • Zero visibility into LED processor, Controllino, UPS, AC, or internet connectivity
  • The network stays dependent on manual checks and external support, without building a richer operational capability over time.

Augmentl Scope: €500/portal/month

  • Problems surface as alerts, responded to in minutes, not at the next check
  • Automated recovery paths. Some faults resolve without human intervention.
  • Structured telemetry history. Recurring fault patterns visible across time, not just in the moment.
  • Full-stack: PC, LED, Controllino, UPS, AC, WAN, cameras. All layers, one view.
  • Begins encoding operational knowledge into the tool. Alerts can reach more than one person, and automated recovery reduces single-person dependency.
Video Window tells you something failed, after someone notices. Scope can know something failed, and in some cases fix it before anyone notices.
Overview tab
Overview
Tab 1 / 8

Live status at a glance.

  • Live stream + operator display
    Both camera feeds update on demand. See exactly what the kiosk and operator are seeing right now.
  • Stream health monitoring
    VW running state, display live/blank, stream freeze detection, auto-blank logic. All in one status block.
  • Full system telemetry
    CPU, RAM, disk, temps, uptime, VW state, LED brightness, presence state. Single panel, no PC remote session required.
  • WAN + power at a glance
    Internet state, latency, 30-day uptime, UPS power mode, Tailscale status.
  • One-tap recovery actions
    Restart VW, reboot PC, force screenshot refresh. Scoped controls with confirmation.
Camera tab
Camera
Tab 2 / 8

Camera setup and monitoring, built into the controller.

  • Live camera preview
    Stream the kiosk camera directly in the app. Verify framing, exposure, and image quality from anywhere.
  • Exposure and white balance
    Adjust brightness, contrast, saturation, WB mode, all via VISCA over the portal bridge. No physical access needed.
  • Virtual tilt and lens correction
    Software tilt and lens correction applied at the source. Adjust the field of view remotely after commissioning.
  • Presence detection tuning
    Adjust presence detection thresholds and see real-time occupancy state.
Screen tab
Screen
Tab 3 / 8

Full LED display control.

  • NovaStar brightness control
    Direct TCP command to the VX400. Set brightness 0–100%, blank, and unblank directly from the controller without NovaCT or Windows.
  • Auto-brightness modes
    Manual, time-of-day schedule, or live solar irradiance via weather API. All configurable per portal.
  • Thermal override logic
    Automatic brightness reduction when panel temperatures exceed safe thresholds. Protects the LED at every site.
  • Panel temperature map
    Per-panel temp grid from NovaStar telemetry. Spot hotspots before they become failures.
  • Brightness reasoning log
    See exactly why the current brightness was set: source, logic, override reason, last change time.
Hardware tab
Hardware
Tab 4 / 8

Deep hardware visibility.

  • Controllino system state
    Firmware version, uptime, loop timing, heartbeat interval, boot reason, watchdog resets. The full embedded controller picture.
  • AC unit monitoring
    Controllino → Modbus → probe temps, alarm states, compressor state per AC unit in the cabinet.
  • WAN failover history
    Peplink dual-WAN with live path state. See which link is active, latency per path, and recent failover events.
  • UPS state
    Bicker supercap charge state and power input. Know before the site loses mains whether the backup is ready.
  • Power + reboot controls
    Controlled PC shutdown, hardware reboot via Controllino relay. No physical access required.
Power tab
Power
Tab 5 / 8

Power, UPS state, and operating cost in one tab.

  • UPS + supercap readiness
    Input/output voltage, AC presence, charging state, and available ride-through are visible without walking to the cabinet.
  • Live mains vs LED draw
    Input and LED screen channels are broken out separately, so abnormal draw is obvious immediately.
  • Operational cost estimator
    Daily, monthly, and yearly run-cost projections are built into the controller instead of hidden in a spreadsheet.
  • Carbon + geography aware
    Country-specific CO₂ factors make energy usage legible to non-technical stakeholders too.
  • Cumulative totals
    Server-side accumulation turns momentary power into a long-term operational ledger.
Events tab
Events
Tab 6 / 8

An operational timeline, not a mystery.

  • Newest-first incident history
    Thermal alerts, blanking events, reboots, WAN failovers, and stream-health actions land in one chronological trail.
  • Recovery visible in context
    Auto-blank, auto-restart, and unblank actions are shown alongside the fault that triggered them.
  • Color-coded event types
    Screen, thermal, WAN, reboot, AC, and PC state changes are visually separated so the pattern reads at a glance.
  • Portal-local and Berlin time
    Operations can read the event history in the site timezone and HQ timezone simultaneously.
  • Root-cause breadcrumbs
    When something goes wrong, the first diagnostic pass is already in the log instead of living in one person's memory.
Uptime tab
Uptime
Tab 7 / 8

Audience-visible uptime, separated from raw process uptime.

  • Latest, 7d, and 30d actual uptime
    Healthy stream, live screen, and fresh telemetry are rolled into a metric that matches what the audience experiences.
  • Breakdown by failure mode
    Screen blank, stream bad, degraded hours, and heartbeat stale are called out explicitly instead of buried in a single number.
  • Daily rollup history
    A 30-day bar history makes recurring weak spots obvious across time, not just during today's incident.
  • Raw process uptime still visible
    The controller keeps cumulative VW uptime in view, but no longer confuses it with whether the artwork was actually live.
  • Network-scale reporting base
    This is the first tab that can support network-wide reliability reporting without manual interpretation.
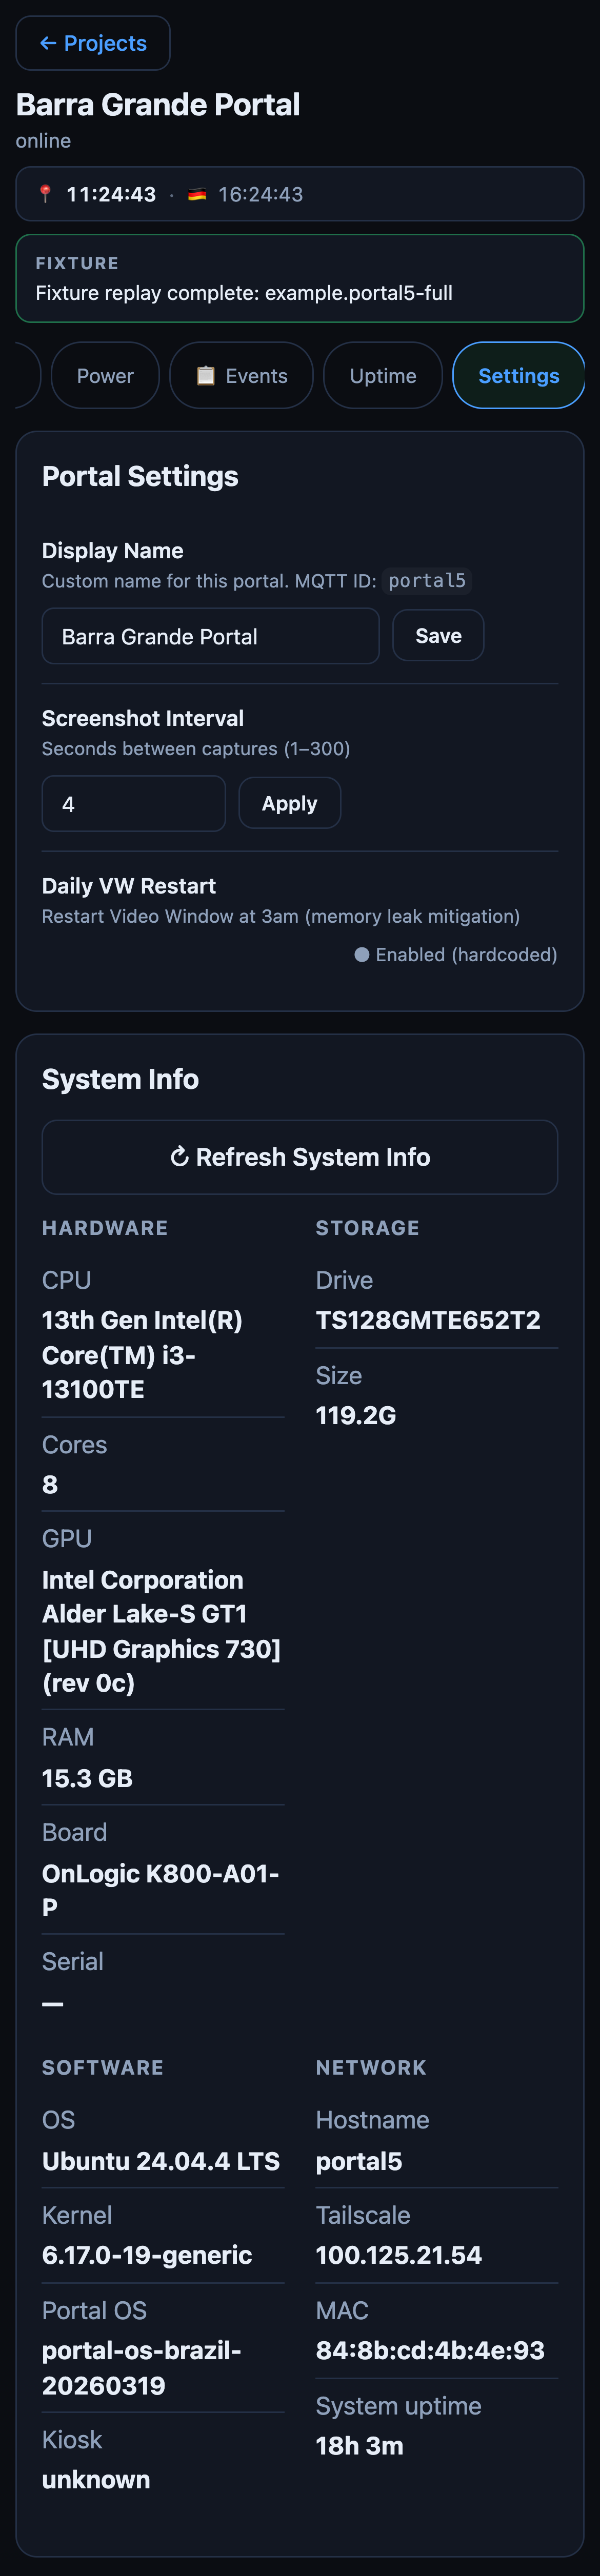
Settings tab
Settings
Tab 8 / 8

Portal settings and hardware identity in one place.

  • Portal naming and screenshot cadence
    Operational polish lives in the app, not in ad-hoc config files and remembered commands.
  • Refreshable system inventory
    CPU, GPU, RAM, disk, OS, kernel, tailscale IP, and uptime are available in one place for support handoff.
  • Hardware identity at a glance
    Board model, serial, and storage details make remote diagnostics faster before deeper support is needed.
  • Safer support workflow
    Routine changes stay scoped to the controller instead of inviting shell access for every minor task.
  • Operational ownership
    The team can understand what hardware is deployed and how it is configured without depending on a single operator's notes.
Next layer

The next worthwhile expansions are already clear.

Client surface

Limited client-facing portal views

Portals have already expressed interest in a scoped app where a site like Dublin can see the status of its own portal, with login-based access and only a small, targeted subset of telemetry and actions.

  • Per-client login and permissions
  • Portal-only status and health summary
  • Scoped actions like blank or blur for their own screen only
Installation layer

Better PC-side install and runtime management

The bridge/runtime on the portal PC is becoming its own product surface: installation, updates, service orchestration, screenshots, stream supervision, and safer packaging for deployment and recovery.

  • Cleaner install/update path on the portal PC
  • More explicit service ownership and restart strategy
  • A stronger base for future portal-side software replacement
Dashboard expansion

Deeper project workspaces

Augmentl Dashboard can grow into the place where fleet view, project context, incident history, and rollout planning meet, while the controller remains the deep per-portal action surface.

  • Per-project operational context
  • Link rollout/planning with live portal health
  • Keep one data model across dashboard and controller
Security

Access, hosting, and data handling can be structured to fit Portals' needs.

Encrypted transport

All commands and telemetry flow over MQTT/TLS and WebSocket Secure (WSS). Nothing travels in the clear between Cortex, the cloud hub, and the portal sites.

No direct hardware exposure

Portal hardware is never directly internet-accessible. The Scope Bridge on the Portal PC initiates all outbound connections. No inbound ports required at the site.

Authenticated controller access

The Scope Controller requires authentication before any portal is accessible. Per-portal command permissions can be scoped per user.

Deployment-chosen infrastructure

Telemetry, screenshots, and operational data can live on infrastructure chosen for the deployment: portal-owned, partner-managed, or otherwise agreed. The hosting model can match Portals' governance needs instead of forcing a generic vendor platform into the middle.

Why this matters

Why adopting Scope is strategically stronger than buying a narrower tool.

For Portals operationally

  • Faster diagnosis when a portal goes dark
  • Fewer blind recovery attempts and fewer avoidable site visits
  • More confident remote support without relying on local staff to interpret faults
  • A stronger operational baseline for legacy portals, current portals, and future portals

For Portals strategically

  • Portals gains a purpose-built operational stack from the partner already helping run the network, rather than a narrower off-the-shelf capability
  • The network gains a technical backbone instead of another stitched tool
  • Portals can adopt it for its own network while Augmentl continues developing the underlying product and IP
  • That matters because the product can keep improving across portals, future portals, and non-portal installations too
The ask

Adopt Scope for the portal network as a shared operational platform, developed and operated in partnership.

The proposal is the same commercial level as Video Window: €500 per portal per month ongoing. In return, Scope becomes the support, commissioning, monitoring, and continuous-improvement layer for the portal fleet, with the implementation and hosting model agreed to fit Portals' needs.

  • Formalise Scope as a shared operational capability for the portal network, with roadmap, rollout plan, and clear technical ownership
  • Agree the operating model: who hosts what, who manages access, and which layers stay portal-owned versus partner-managed
  • Use the ongoing fee to fund continued product development, monitoring, and support as part of the contracted scope

Bottom line. This creates the same kind of ongoing commercial relationship Portals was ready to pay for with Video Window, but directs it into a system that already understands the installations and gives a clear incentive to keep improving it proactively.

First step: Agree a pilot rollout plan, governance model, and the €500 per portal per month ongoing commercial structure, then expand Scope across the fleet as the basis for future portals and wider installation work.

Scope

Every installation. Fully in view.

by AUGMENTL STUDIO
nick@augmentl.com